

Atlas has added 17 data feeds covering freight rates, fuel, weather, border crossings, rail service, commodities and trade. Teams can now compare a refrigerated truck quote with USDA’s weekly rate for the same route, check the reported wait for a US-bound commercial crossing, or use FAOSTAT to see where a country exports its crops. Each observation carries its source and reporting period.
The feeds give teams another reference when they review a shipment in Atlas. A carrier agreement tells you what rate you agreed to pay. An invoice tells you what the carrier charged. A published freight benchmark helps you judge whether a quote is in line with the market for that route and week.
Comparing a freight quote with USDA’s weekly benchmark
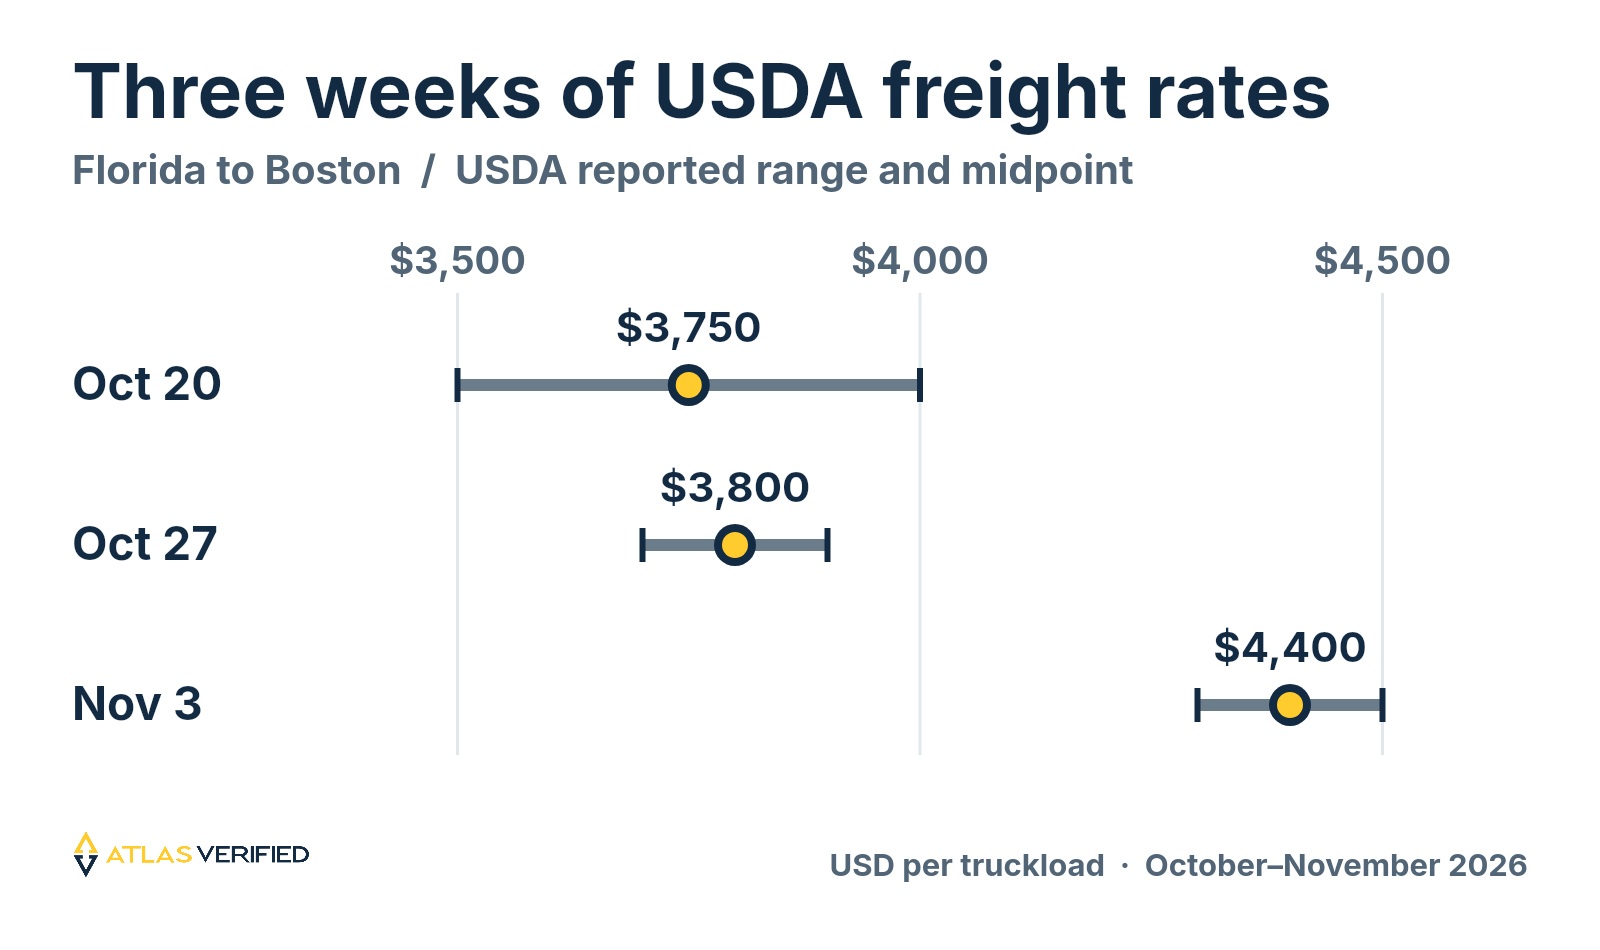
On October 27, 2026, USDA reported a midpoint of $3,800 per refrigerated truckload from Florida to Boston. On November 3, the range was $4,300 to $4,500. The new midpoint was $4,400, up $600 in a week. A buyer using the previous midpoint as a budget could see that it now fell $500 below even the low end. USDA’s weekly refrigerated truck rates and availability.
USDA lists the route at 1,280 miles. The November 3 midpoint therefore works out to about $3.44 per mile. Atlas keeps the truckload rate and the per-mile rate separate and compares each with the same measure from the previous week. On a per-truckload basis, the increase was 15.8%. To investigate whether fuel contributed, a buyer can check EIA’s diesel series for the region and then ask the carrier how its fuel surcharge was calculated. EIA regional diesel prices.
Checking transfer facilities, border waits and rail service
A different question comes up when a shipment changes hands. Suppose a dispatcher needs a place to transfer freight from rail to truck near Houston. Cando publishes handling information for its Channelview terminal. Watco publishes a different set of capabilities at its Texas terminals. Atlas brings those facility records into the search so the dispatcher can narrow the calls to operators that handle the right cargo. That leaves one practical question for the operator. Can you handle this commodity, in this equipment, on this date?
The same discipline applies at a crossing. US Customs and Border Protection reports commercial wait times for individual US-bound lanes. A reported wait of zero means something different from a closed lane or a lane with no published reading. A dispatcher choosing a crossing needs the direction, the lane and the time of the report. A railroad’s weekly terminal dwell figure, by contrast, gives a planner context about the carrier’s network. The shipment record connects that context to the railroad carrying the load. CBP Border Wait Times and Surface Transportation Board data.
Looking up trade volumes, commodity prices and futures positions
For a grain buyer, the next question may be about the cargo itself. FAOSTAT reports about 62.6 million tonnes of US maize exports in 2024. That national figure answers how much the US exported over the year. The bilateral trade matrix lets a buyer examine the destinations. The World Bank’s monthly Pink Sheet answers a different question about benchmark prices, while CFTC reports show how groups of traders were positioned in futures. Each series keeps its own period and units in Atlas so a buyer can move from one question to the next without mistaking tonnes, dollars and contracts for the same measure. FAOSTAT trade totals and World Bank commodity prices.
Which data sources does Atlas Verified use?
Start with the decision you need to make. A national import series can show demand for a product. A bill of lading can identify the parties on a particular shipment. An organic certificate can tell you which operator and products its issuer covers. Here is where each type of evidence comes from.
Freight rates, facilities and shipment conditions
- Truck, barge, rail and ocean costs. USDA Agricultural Marketing Service publishes weekly refrigerated truck rates and availability, grain transportation measures and quarterly refrigerated freight benchmarks by distance and origin–destination pair. The US Energy Information Administration supplies US and regional diesel prices, crude oil, natural gas and inventory series.
- Road, weather and border conditions. NOAA’s National Weather Service supplies US weather alerts, plus station observations and forecasts for the Port Houston and Houston Intercontinental Airport areas. The City of Austin’s Work Zone Data Exchange feed covers local road work. CBP supplies reported northbound commercial waits from Mexico and US-bound waits from Canada.
- Railroads and motor carriers. The Surface Transportation Board publishes carrier service measures, including train speed, terminal dwell and grain-car order backlogs. The Federal Motor Carrier Safety Administration’s Company Census supplies carrier registrations and reported equipment. Operators confirm equipment availability for a booking.
- Houston transloading. The facility directory draws on the published Houston Elevator listing from Hansen-Mueller, PSC Group’s Bayport Rail Terminal, Watco’s Texas Terminal, Cando’s Channelview Terminal, and Houston Terminal LLC’s container freight station operations. The date and the operator’s published handling description belong with each listing.
- Shipment history and position. Historical bills of lading and licensed international trade records connect shippers, consignees, products, ports and vessels. AIS vessel observations, port reference records in the World Port Index, and UN/LOCODE location codes help distinguish a vessel’s observed position from its documented route. For confirmed aircraft identifiers, Atlas supports ADS-B observations from adsb.lol under its Open Database License. Aircraft coverage depends on receiver coverage and a confirmed flight leg.
Commodity markets, trade and labor
- Commodity prices and market reports. The World Bank Commodity Price Data (Pink Sheet) covers monthly benchmarks across agriculture, fertilizers, energy and metals. USDA Market News and My Market News supply agricultural market reports. The Federal Reserve Bank of St. Louis’s FRED database supplies economic and commodity price series. Atlas also keeps dated futures quote snapshots separate from cash prices.
- Futures positions and mineral supply. The US Commodity Futures Trading Commission’s Disaggregated Commitments of Traders reports track futures-only positions. US Geological Survey Mineral Commodity Summaries cover production, reserves and import reliance. A weekly change in trader positions and an annual estimate of reserves describe different time horizons.
- Imports and exports. FAOSTAT provides national agricultural trade totals and bilateral trade flows. The US Census Bureau’s International Trade data, the US International Trade Commission’s DataWeb and UN Comtrade provide official merchandise trade statistics. Eurostat Comext adds initial coverage for Germany, France, the Netherlands, Italy, Spain and Poland trading with the US and China. Keep the product classification and reporting country alongside each value.
- Labor and economic context. The International Labour Organization’s ILOSTAT provides labor observations by indicator and reporting period. The World Bank’s World Development Indicators add country-level economic context for sourcing comparisons.
Customs, company identity and compliance
- Tariff classifications and customs instructions. The USITC Harmonized Tariff Schedule of the United States provides US import classifications and published rates. CBP Cargo Systems Messaging Service notices document selected implementation changes. A rate check depends on the product, origin, effective date and applicable provisions. US Harmonized Tariff Schedule.
- Company identity and screening. The Global Legal Entity Identifier Foundation (GLEIF) supplies legal entity identifiers and reported parent relationships. US Treasury Office of Foreign Assets Control (OFAC) sanctions records and the International Trade Administration’s Consolidated Screening List bring together Treasury, Commerce and State Department screening information. The FBI Wanted list and INTERPOL’s public Red Notices provide separate, named sources for identity review.
- Product safety and law. US Food and Drug Administration food enforcement and recall records are available through openFDA. Atlas’s Global Legal collection indexes legal texts by jurisdiction and date and preserves references to the underlying publication. A reviewer can check the actual entity, product or provision before applying the evidence to a supplier.
Organic certification and supplier verification
Atlas holds records from 35 certification sources. Some are national government registers. Others are regional authorities or individual certifiers. A useful match includes the operator’s legal name, the issuing authority, the certification scope and the date on the record. Here are the sources represented in the directory.
- Americas. USDA Organic Integrity Database (National Organic Program), Canadian Food Inspection Agency organic sources, including Pacific Agricultural Certification Society (PACS) and Pro-Cert, Argentina’s SENASA organic records, Brazil’s MAPA SisOrg register, CERTIMEX’s Mexican LPO register, and Metrocert’s Mexican LPO register.
- Europe. European Commission TRACES organic records, France’s Agence Bio organic directory, UK Department for Environment, Food & Rural Affairs organic sources, Norway’s Debio register, Denmark’s agricultural organic farm register, Denmark’s veterinary and food administration inspection register, the Czech Ministry of Agriculture organic register, and Bulgaria’s Ministry of Agriculture and Food organic-control register.
- Spain and Italy. Spain’s national REGOE directory, Catalonia’s CCPAE operator directory, Andalusia’s SIPEA register, Emilia-Romagna’s organic operator register, the Province of Trento operator list, and CCPB’s public EU and Canadian organic certificates.
- Ukraine. Ukraine’s state register of organic operators, Ukraine’s state register of organic certification bodies, and Organic Standard’s Ukrainian operator directory.
- Asia. India’s APEDA TraceNet, IMO Control India’s Canada Organic Regime records, Chinese government organic registers, Japan’s MAFF Japanese Agricultural Standards (JAS) organic records, South Korea’s National Agricultural Products Quality Management Service (NAQS), Taiwan’s Agriculture and Food Agency register, Organic Agriculture Certification Thailand (ACT), and BIOCert Indonesia.
- Oceania, Africa and international programs. Australia’s Department of Agriculture organic sources, New Zealand Ministry for Primary Industries organic sources, including AsureQuality, Ecocert and CERES registers covering Uganda, and Mayacert’s JAS register for participating operators across countries.
Have a freight quote you’re trying to make sense of? Bring the route, equipment and pickup week. We’ll walk through the closest published benchmark and the shipment records that matter to that decision. Explore Atlas Freight Intelligence or book a walkthrough.